What is this tool?
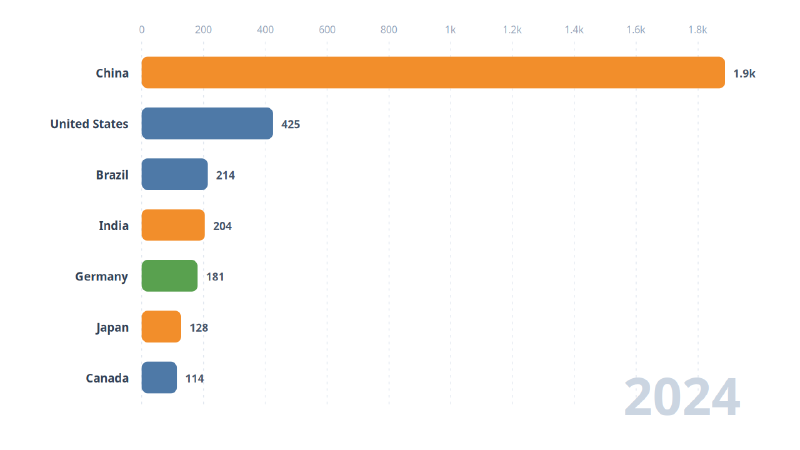
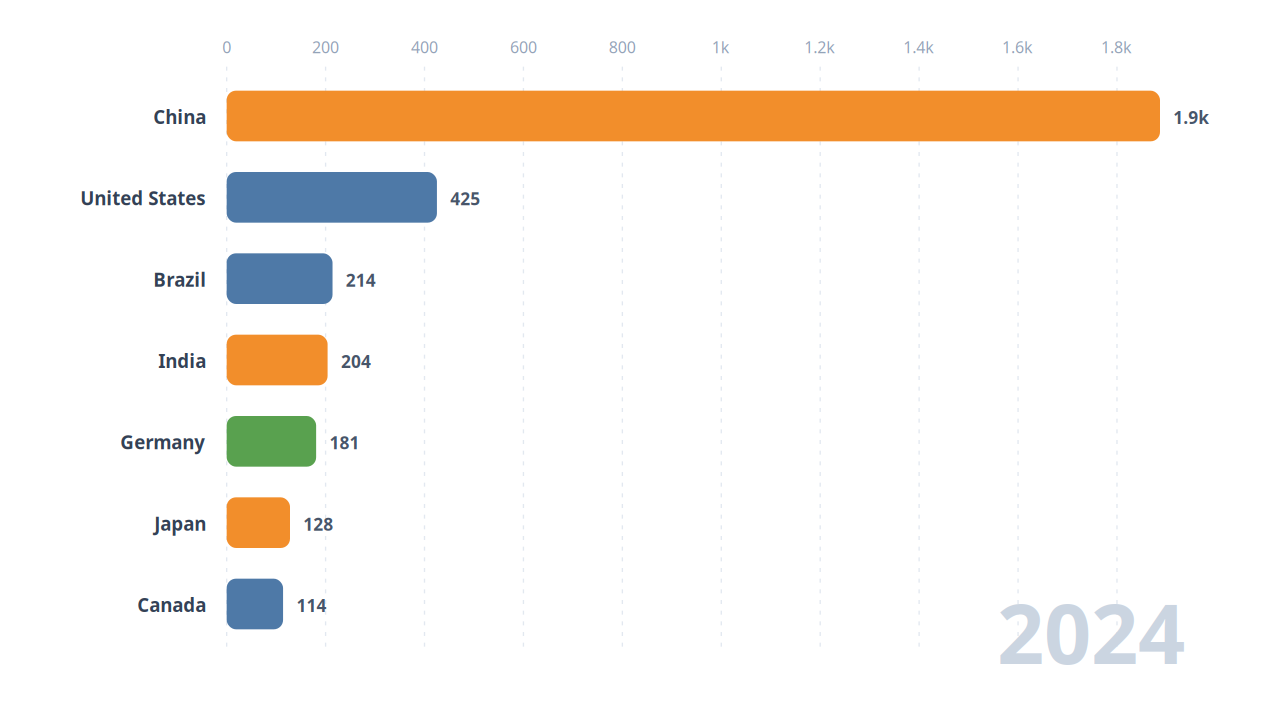
A race-chart builder for animating how rankings and values change over time. Choose one of five templates — bar chart race, bump chart, line chart, scatter plot race, or slope graph — then load a CSV and play it back. Annotations, export, cloud save, and public sharing are included.
Features
- Chart picker: five templates from a catalog on the home screen
- Sample data: featured works for each chart type autoload first; switch from the sample picker
- Playback: play, pause, speed, and loop as time steps advance
- Annotations: title, source, and source URL on the chart
- Appearance: palette, number format, and labels
- Export: SVG / PNG / CSV
- Share: publish a public page (
share.html?id=) from a saved project - Project save: store data and settings in the cloud and restore later
How to use
- Pick a chart type (or let a sample open automatically)
- Upload a CSV or load a sample
- Play the animation and check rankings, crossings, and overtakes
- Add a title and source in the annotation tab
- Export an image or CSV, save as a project, and publish a share page if needed
Data format
- File format: CSV (comma-separated, UTF-8)
- Bar / bump / line / slope: wide table.
name(series), optionalcategory(color), then time-step columns (years, etc.) - Scatter plot race: long table.
date,name,category, plus numeric columns for position and size - First row is the header. Time columns run from oldest to newest, left to right