What is this tool?
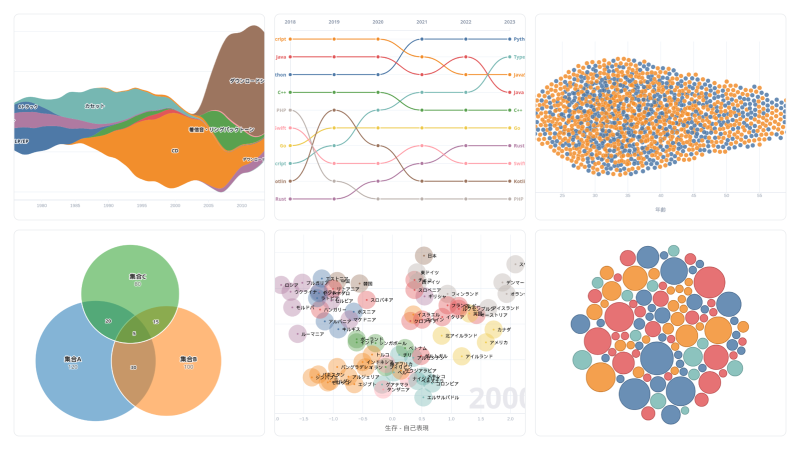
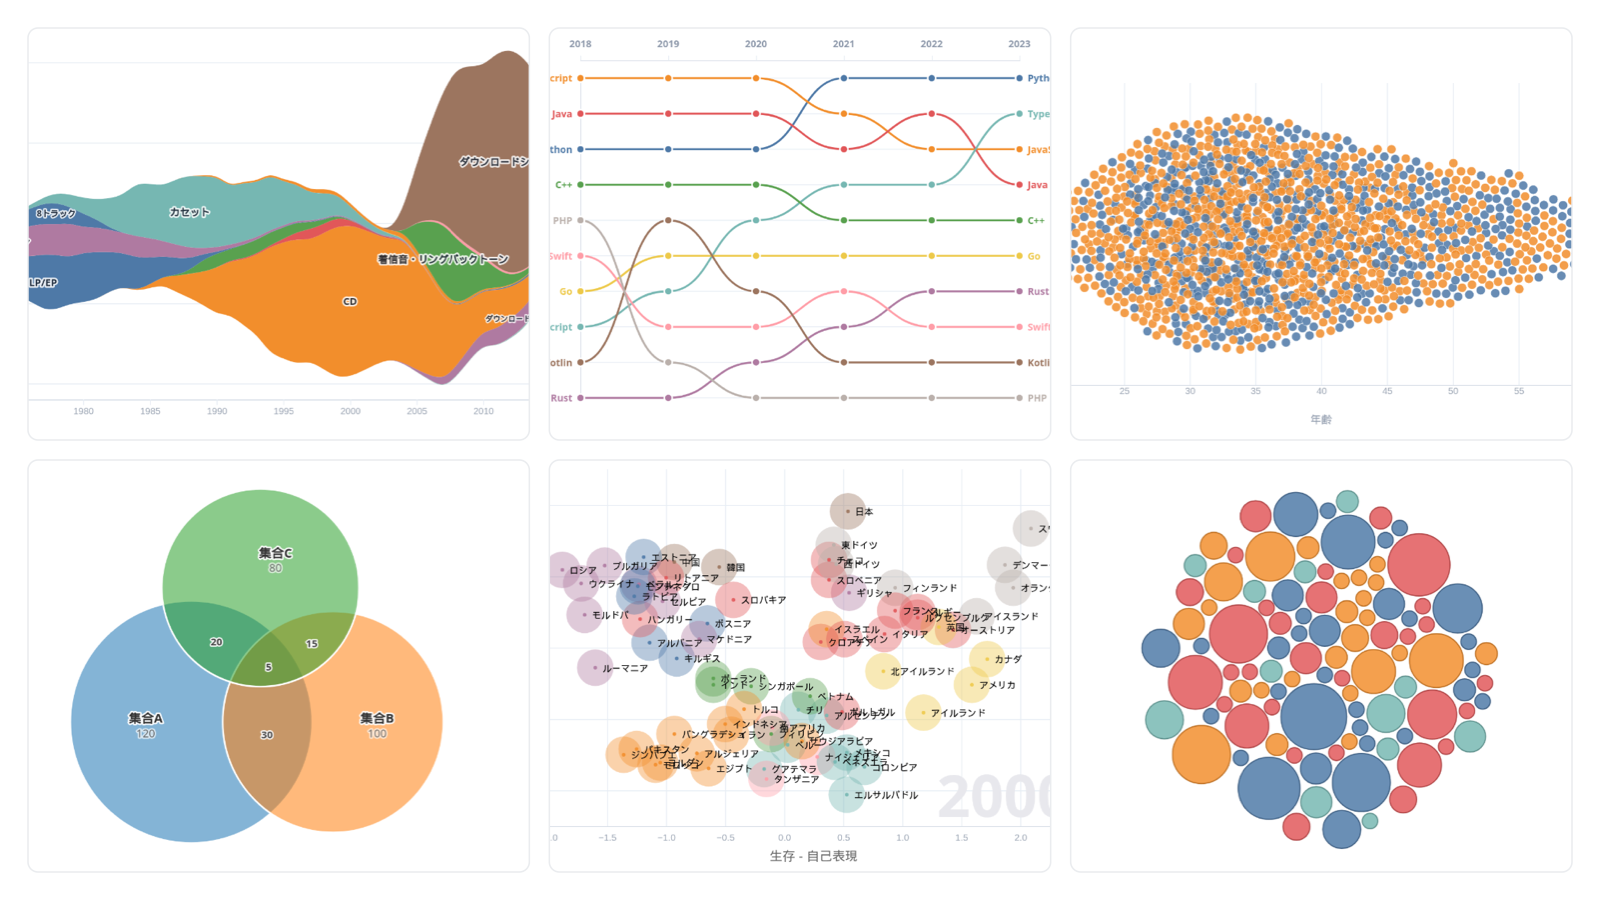
Pick a template and load your data to get a chart that responds to hover and animation. Six templates are available: streamgraph, bump chart, bee swarm plot, Venn / Euler diagram, timeseries scatterplot, and circle packing. Annotations, export, cloud save, and public sharing are included.
Features
- Templates: streamgraph, bump chart, bee swarm plot, Venn / Euler diagram, timeseries scatterplot, circle packing
- Sample data: choose from samples that match each chart
- Mapping: set the columns used for axes, series, size, and color
- Appearance: color scheme, curve type, stacking mode, point and circle size, and more
- Public controls: play and scrub years in the timeseries scatterplot, switch axes in the bee swarm plot, toggle regions / union in the Venn diagram, highlight a series in the bump chart, and more
- Annotations: title, source, and legend position
- Export: SVG / PNG / CSV / JSON
- Share: publish a public page (
share.html?id=) from a saved project and embed it with an iframe - Project save: store data and settings in the cloud and restore later
How to use
- Pick a template from the catalog (a sample opens)
- Upload a CSV / JSON file, or load a sample
- Check the columns in Mapping
- Add a title and source in the annotation tab
- Export an image, save as a project, and publish a share page if needed
Data format
- File format: CSV / JSON
- Streamgraph and bump chart: a time column plus one column per series (wide), or time / category / value columns (long)
- Bee swarm plot: a numeric column and a category column for color
- Timeseries scatterplot:
countryandyearcolumns, plus numeric columns for the X and Y axes - Circle packing: a label column and a numeric column
- Venn / Euler diagram: no file; edit set names and sizes on screen